Robust monitoring and alerting systems enable your organization to identify, diagnose, and address any issues that may arise in your event tracking setup.
Hightouch has three primary features to support engineering and growth teams in managing event collection and data activation:
- Per-source volume graph
- In-app live debugger
- Per-sync configurable alerts
We'll look at a few examples of how you can leverage these features.
Monitoring event volume
Teams can get a quick overview of event volume over time with Hightouch's built-in visualization. Each event source page shows a graph of event volume at 1, 3, and 7 day time periods.
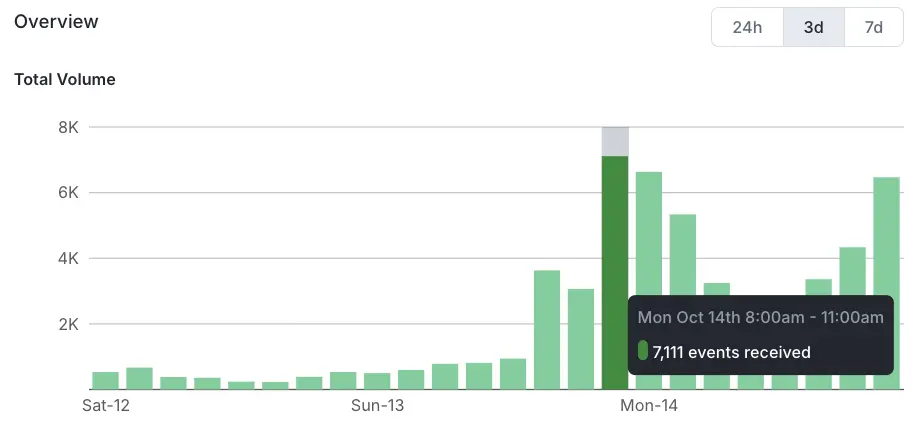
This visual representation helps you quickly identify unusual spikes or drops in event volume, which could indicate issues with data collection or unexpected changes in user behavior.
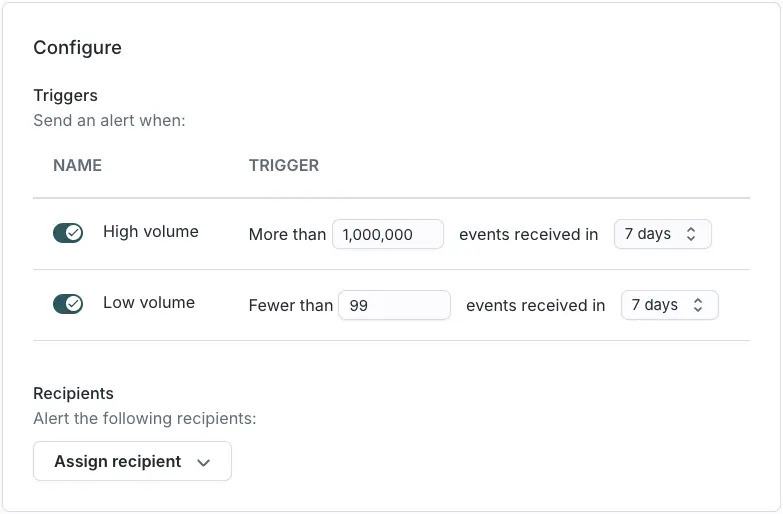
While human checks are great, most organizations will want automated alerts to notify the engineering or analytics team of noticeable drops in event volume.
Events uses Hightouch's configurable alerting system in conjunction with event-specific triggers to send messages by email, SMS, Slack, or PageDuty. You can configure an alert so that a team member or Slack channel is notified when event traffic drops below a particular level, enabling your team to investigate the occurrence quickly.
Detecting event violations
Hightouch also supports alerting based on your event contracts. Contracts can send invalid events to a violations table in your warehouse. That sync to the warehouse can send an alert when violations exceed a threshold in a given time period for particular types of violations.
To understand a particular set of violations, you can use the live debugger associated with each event source. The debugger enables you to inspect individual events and their payloads to understand schema and contract violations. This event-level view complements macro-level monitoring to provide teams the information they need to remediate errors.
Alerting on downstream sync issues
Hightouch supports row and sync-level alerting for reverse ETL syncs, and treats event syncs the same. You can set up alerts to notify your team when there is an elevated row rejection rate, such as a particular percentage of rows failing during a sync to your data warehouse. You can also be notified when there is a series of consecutive syncs with fatal errors. Both types of alerts enable an engineering and analytics team to dive in and address sync inconsistencies or errors quickly.
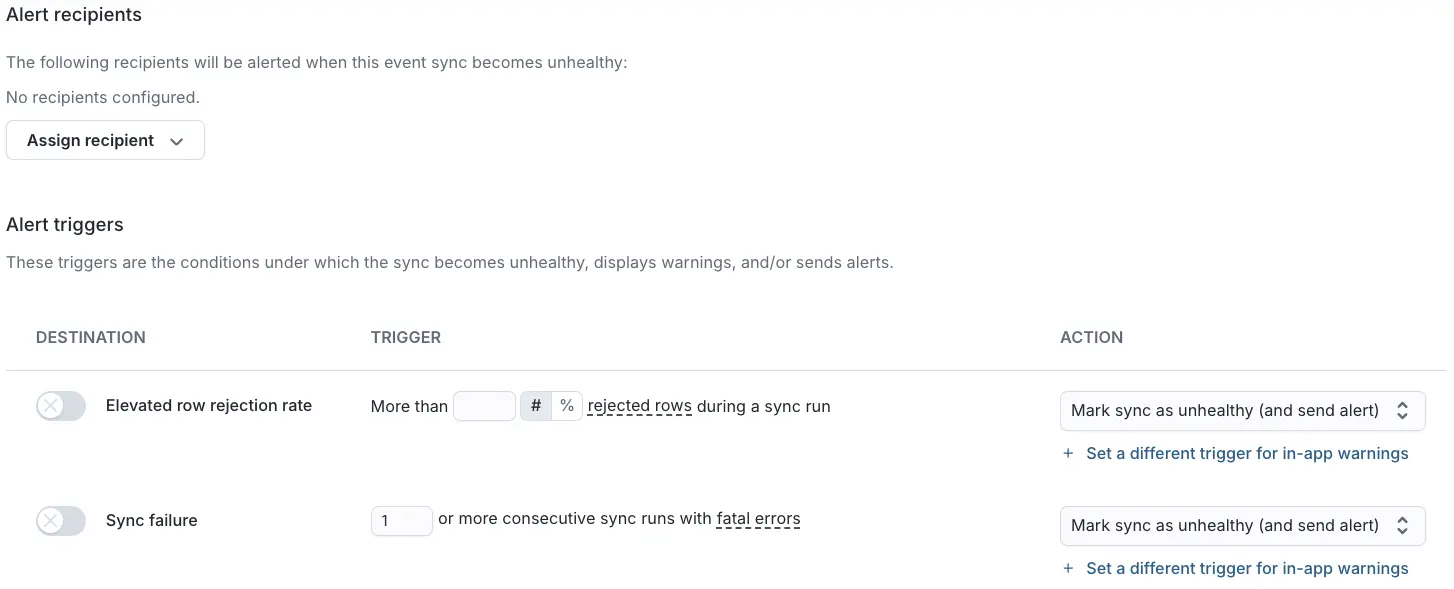
These specific alert triggers are a beta feature. Please for access.
Regular reviews and maintenance
While Hightouch's automated monitoring and alerting features do much of the heavy lifting, regular human oversight is still crucial. Monthly and quarterly reviews of Hightouch's data quality are important, and teams need to update contracts to account for new events or properties in their tracking plans.
Leveraging Hightouch's built-in monitoring and alerting capabilities sets your organization up for long-term success with your event data. These tools help maintain data quality and provide valuable insights into your data collection processes and user behavior patterns.
In the next, and final, section, we'll update downstream applications and destinations that consume event data.